Boy, 5kg weight, 6 weeks of age
Use the weight-for-age growth chart and plot the points as outlined above
After completing measurements it is important to try to identify trends, or patterns, of growth for your child. Please follow the below steps to assess your child’s growth.
This article is provided as guidance and should not be used as a substitute for medical advice.
In this case, please skip step 1 and move directly to step 2.
In this case, please follow all the below steps.
Reminder: If you have previous measurements (i.e. from your previous medical appointments) but these have not been plotted on a growth chart, please plot all growth measurements together on a new growth chart and follow all the below steps.
Use the World Health Organization (WHO) growth charts in the link below, or WHO-based local country growth charts, which may be obtained online from your country’s local health department.
Choose the appropriate chart for your child based on their age and gender:
Note: For home growth measurements, it is best to focus on 2 categories of charts:
Weight-for-age and Height-for-age
Find the age on your child’s growth chart first (this will be on the x-axis/the line at the bottom of the chart) and use a ruler to help guide you to plotting the weight/length/height (on the y-axis/the line on the left hand side on the chart) that correspond to the child’s measurements. Please see the example below.
Note: It is important to establish your child’s age in weeks accurately. It is easier to use an online age calculator to obtain the exact age in weeks for a young baby, to ensure that the plotting of growth is as accurate as possible.
Use the weight-for-age growth chart and plot the points as outlined above
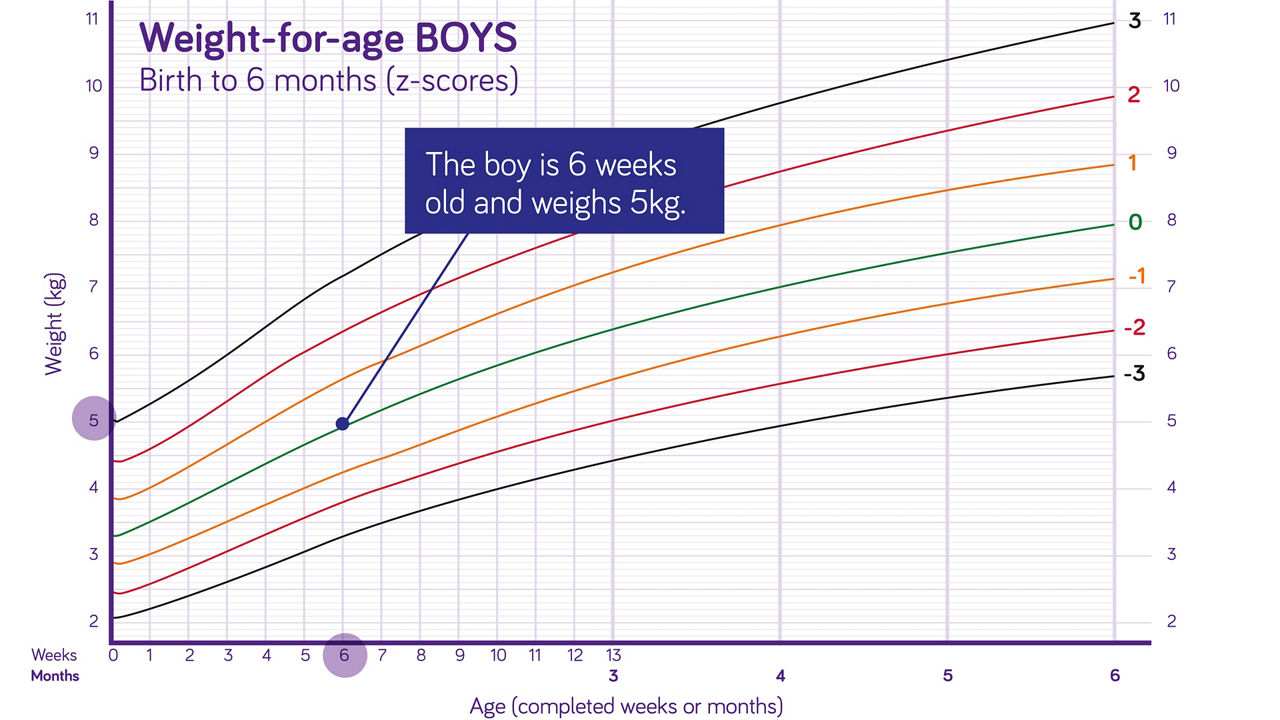
Similarly, plot all the available measurements and connect the points with a straight line to better observe any trends or patterns.
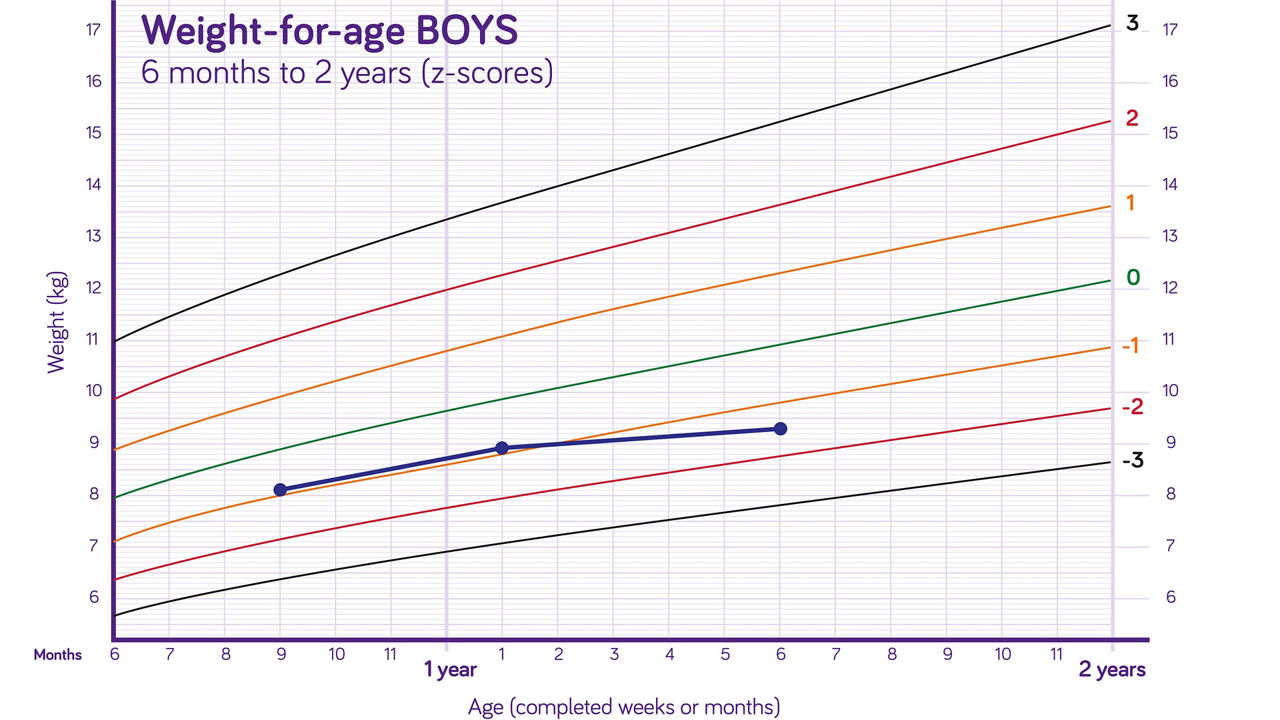
Boy, 3 different measurements over time as shown below:
9 months: 8kg, 13 months: 9kg, 18month: 9kg
The chart opposite shows the growth measurements of a boy plotted on a weight-for-age chart at 3 different times over the course of a year (at 9 months, 13 months, 18 months).
1. Each measurement should be taken twice before you plot your child’s growth on the graph
2. At the first available opportunity please measure your child’s growth at a health clinic with more accurate equipment
Before you start to interpret a growth trend, it is important to understand:
| Above 2,3 | Significantly above average |
| Above 1 | Moderately higher than average |
| Above 0 | Average |
| Below -1 | Moderately lower than the average |
| Below -2, -3 | Significantly lower than average |
| Growth trend | Action | Examples below |
|---|---|---|
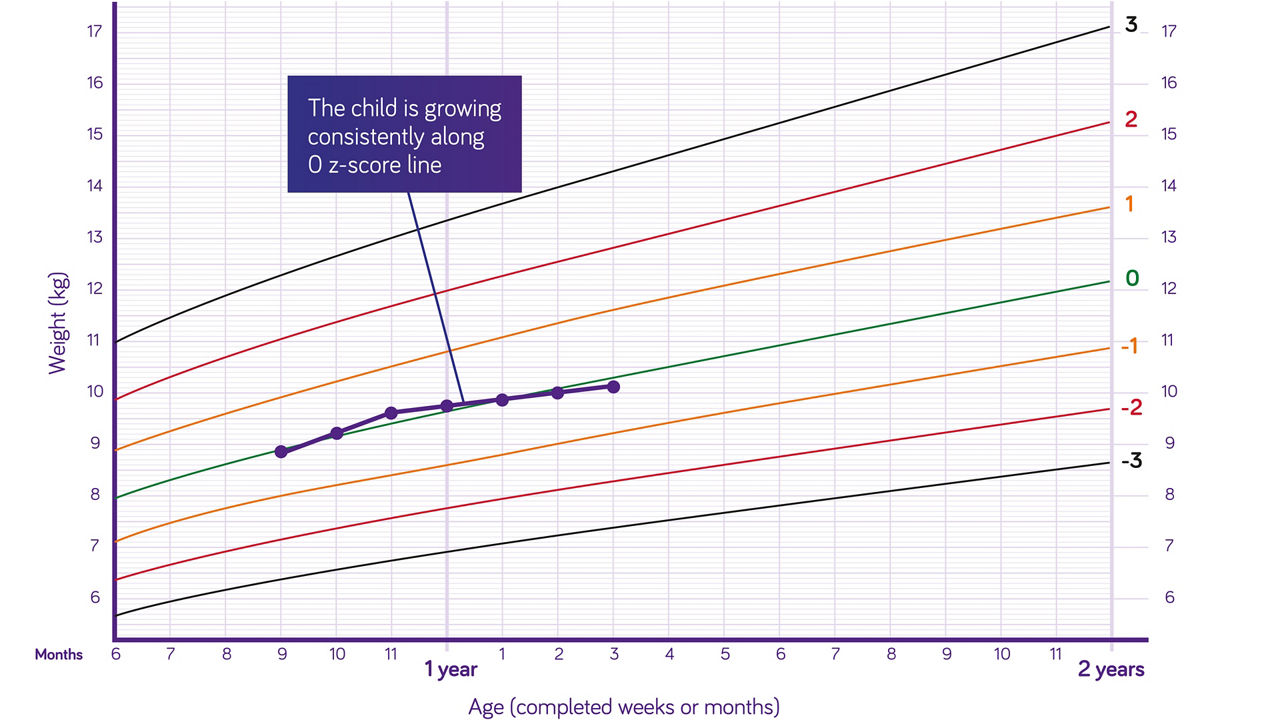
| Child is growing well in weight for age, following the same line | Your child is growing well. Continue to measure growth and observe for any different trend that may develop | Example 1 |
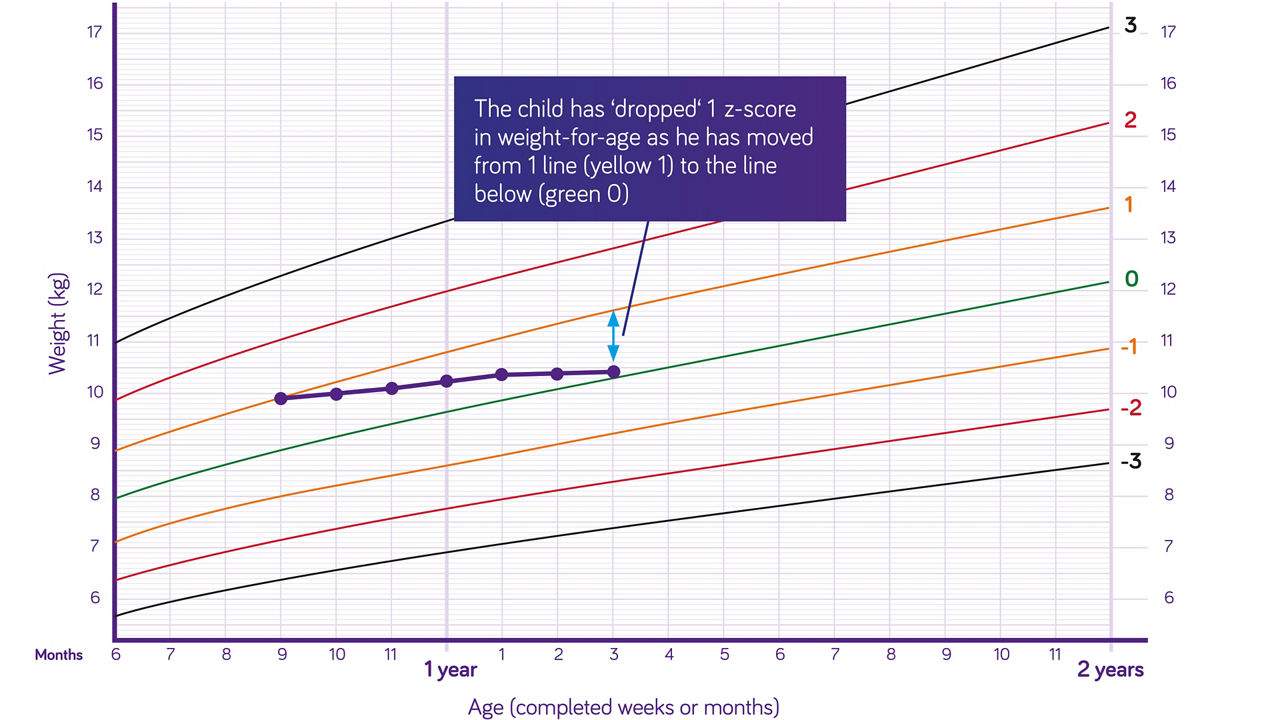
| Child is dropping 1 or more z-score(s) in weight for age (crossing from 1 z-score line to the line below) | Closely monitor and contact your HCP | Example 2 |
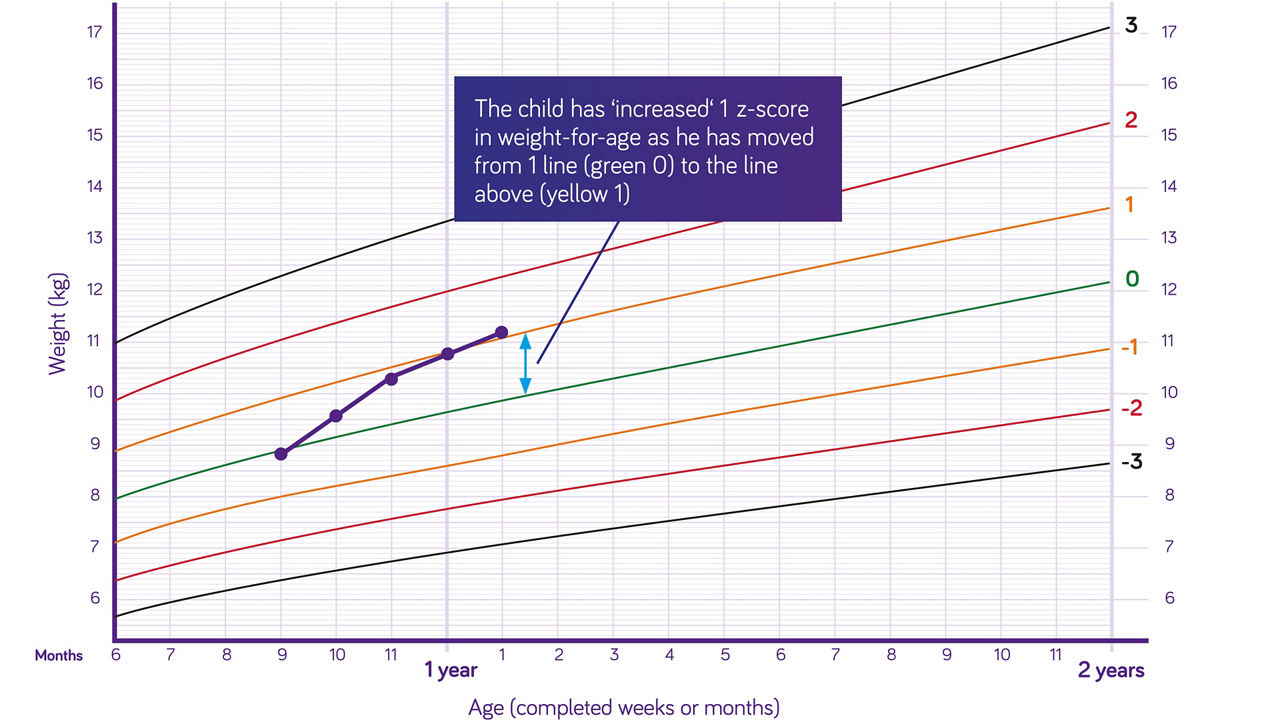
| A child that is gaining weight and is going up 1 or more z-score(s) (crossing from 1 z-score line to the line above) | Closely monitor and contact your HCP | Example 3 |
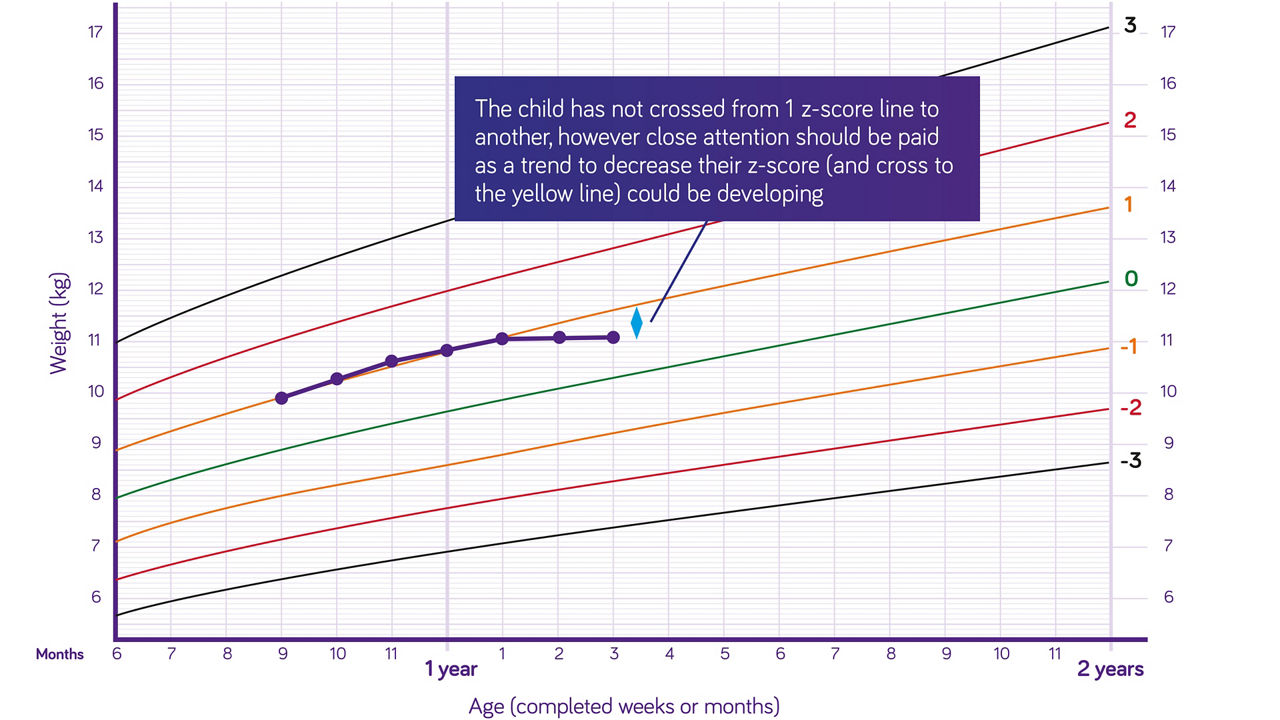
| A child is growing between z-score lines, but has not yet changed z-score | Closely monitor and contact your HCP if you are concerned | Example 4 |
Note: Please look at the 4 below examples and familiarize yourself with the method in order to better support you with the identification of your child’s growth trends or patterns
The product information for this area of specialization is intended for healthcare professionals or (carers of) diagnosed patients only, as these products are for use under healthcare professional supervision.
Please click ‘Yes’ if you are a healthcare professional or (carer of) a diagnosed patient, or ‘No’ to be taken to a full list of our products.
The information on this page is intended for healthcare professionals only.
If you aren't a healthcare professional, you can visit the page with general information, by clicking 'I'm not a healthcare professional' below.